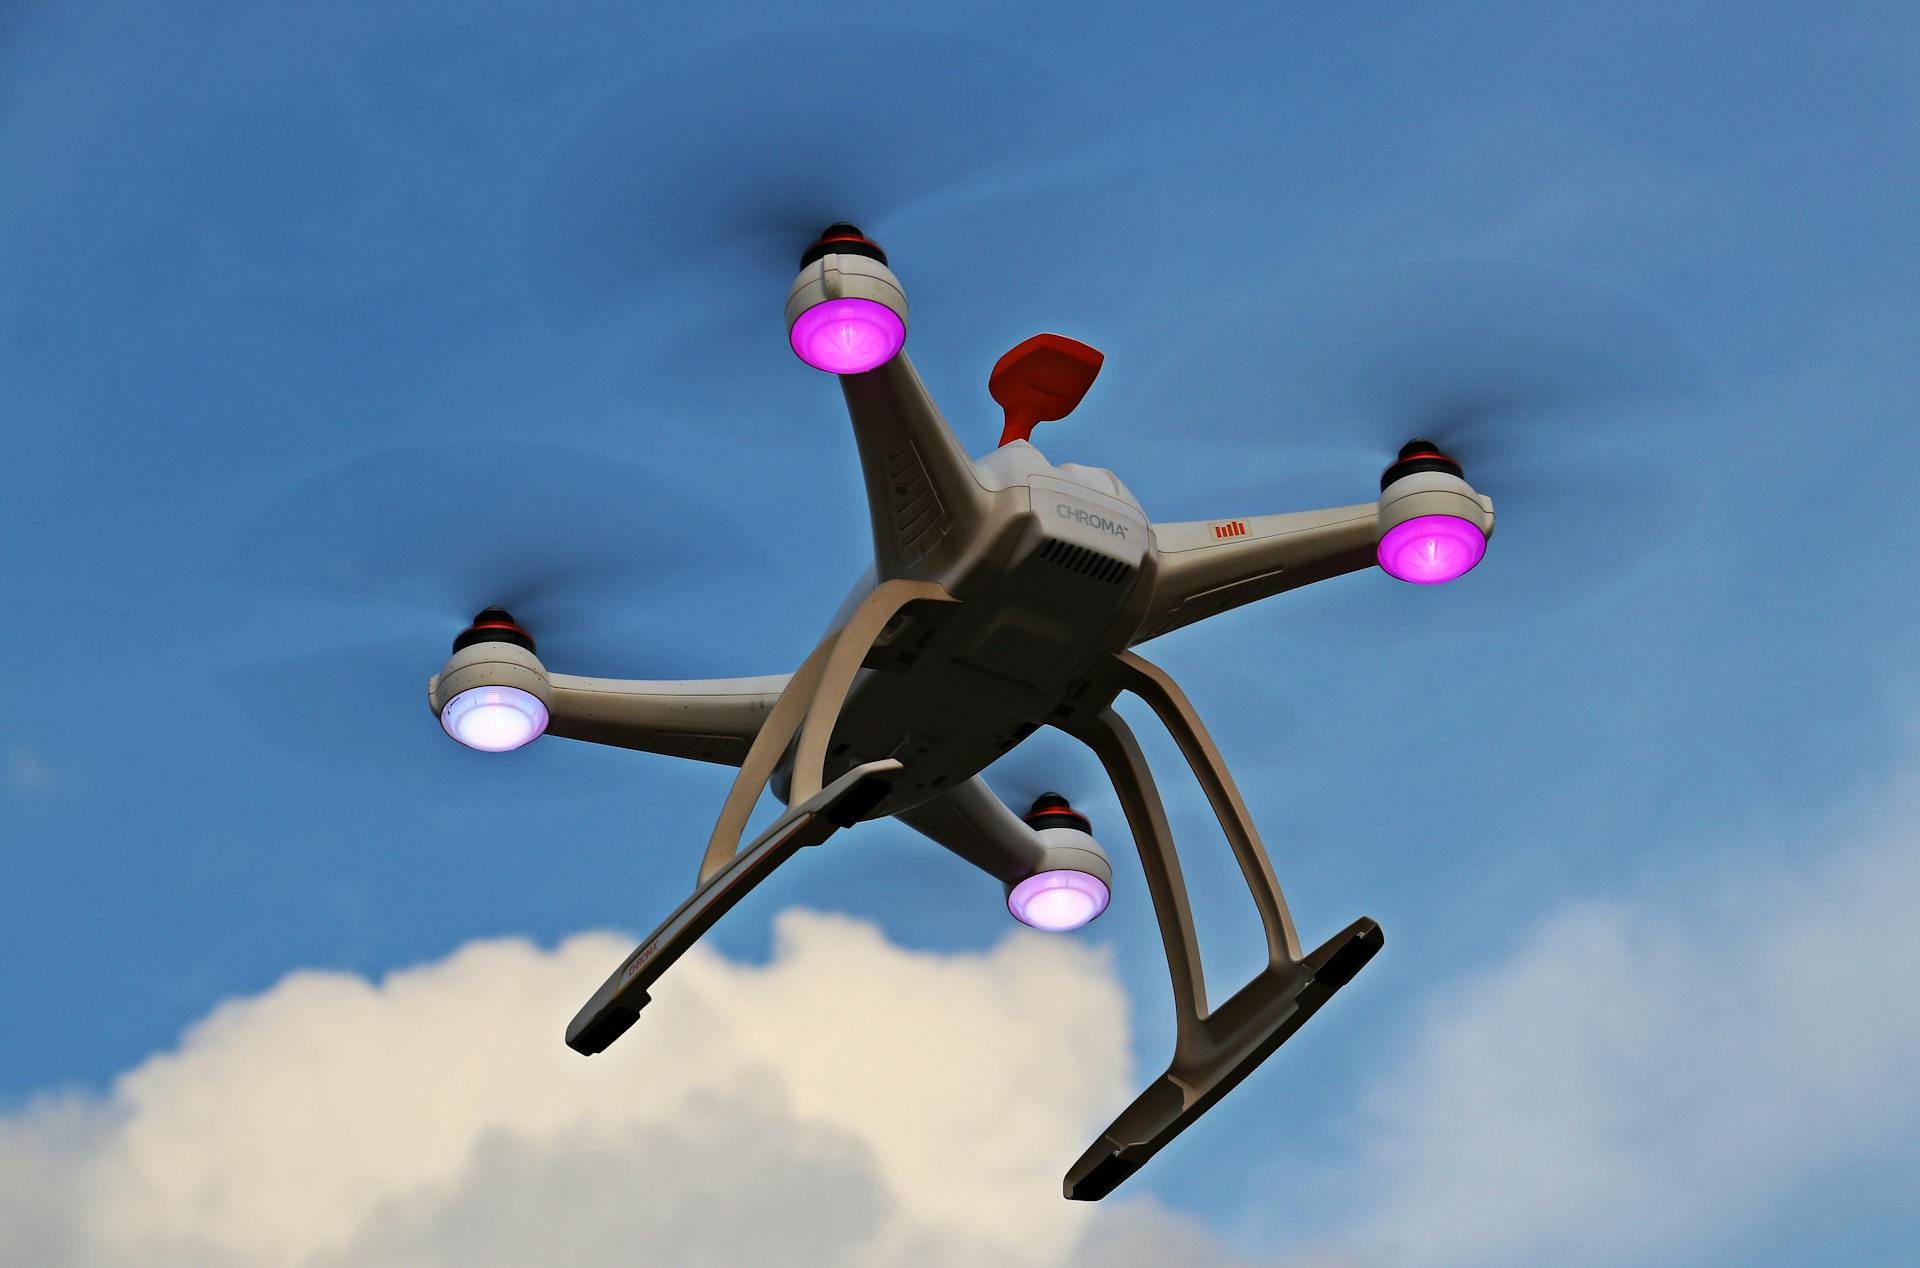
A drone flight produces thousands of images. The value isn't in the images — it's in what analytics extracts from them: distances, volumes, change over time, and defects flagged before a human ever opens the folder.
FROM PIXELS TO MEASUREMENTS
Photogrammetry stitches overlapping photos into orthomosaics you can measure to the centimeter and point clouds you can section like a CAD model. Stockpile volumes, facade areas, and crop coverage come straight out of the data — no tape measures, no climbing, no estimation.
Ground control points and RTK positioning lock that data to survey coordinates, so measurements hold up in contracts, permits, and progress claims.
CHANGE DETECTION BEATS SINGLE SNAPSHOTS
One flight is a photograph; repeated flights are a monitoring system. Aligned to the same datum, weekly surveys reveal earthworks progress, erosion, construction deviations, and vegetation change automatically — with visual diffs any stakeholder can read.
"They mapped our entire 40-acre site in a morning. The orthomosaic dropped straight into our GIS and the quantities matched our ground survey." — Marcus P. Delgado, Site Manager
DASHBOARDS YOUR TEAM WILL ACTUALLY OPEN
Data only matters if people use it. We deliver cloud viewers with annotations, side-by-side timelines, and exports in the formats your stack already speaks — GeoTIFF, LAS, contour packages — plus a walkthrough call so the first login isn't the last.
- Ask for accuracy statements with every map, not just pretty pictures.
- Standardize flight intervals so change detection stays comparable.
- Archive source imagery — reprocessing old flights with new algorithms is free insight.


